
 Skip to content

Our Financial Highlights
Summary financial statements for FY22, FY23, and FY24.
Mitie has delivered revenue, margin, and earnings per share growth since FY21, despite the non-recurring benefit from short term Covid-related work:
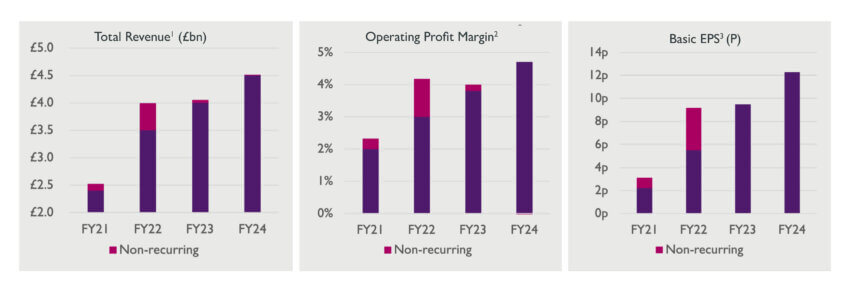
For more information about our recent financial performance, please see our FY24 Annual Report & Accounts.
Summary Financial Statements
The summary financial statements shared below are also available for download in Excel:
| Mitie Group – Summary Income Statement £m | Actuals FY22 | Actuals FY23 | Actuals FY24 |
|---|---|---|---|
| Revenue inc share of joint ventures and associates | 3,773 | 4,055 | 4,511 |
| Operating profit (before other items) | 166.9 | 162.1 | 210.2 |
| Operating margin (EBIT), % | 4.2% | 4.0% | 4.7% |
| Others items | (94.8) | (45.1) | (44.5) |
| Operating profit | 72.1 | 117.0 | 165.7 |
| Net finance costs | (19.8) | (11.5) | (9.4) |
| Profit before tax | 52.3 | 105.5 | 156.3 |
| Tax | (21.0) | (14.4) | (25.4) |
| Profit after tax | 31.3 | 91.1 | 130.9 |
| Profit attributable to non-controlling interest | – | – | – |
| Profit attributable to owners of the parent | 31.3 | 91.1 | 126.3 |
| Basic EPS before other items | 9.2p | 9.5p | 12.3p |
| Basic EPS | 2.2p | 6.8p | 9.8p |
| DPS | 1.8p | 2.9p | 4.0p |
| Dividend pay out ratio | 20% | 30% | 33% |
| Weighted avg no. of ordinary shares for the purpose of basic EPS (million) | 1,395.4 | 1,348.4 | 1,282.9 |
| Weighted avg no. of ordinary shares for the purpose of diluted EPS (million) | 1,538.6 | 1,481.3 | 1,391.8 |
| Mitie Group – Summary Balance Sheet £m | Actuals FY22 | Actuals FY23 | Actuals FY24 |
|---|---|---|---|
| Goodwill and intangible assets | 560.2 | 564.9 | 645.1 |
| Property, plant and equipment | 143.9 | 156.9 | 204.7 |
| Interests in joint ventures and associates | 11.9 | 8.8 | 0.9 |
| Working capital balances | (239.2) | (179.2) | (200.1) |
| Provisions | (117.0) | (111.4) | (113.2) |
| Net debt | 26.7 | (44.1) | (80.8) |
| Net retirement benefit liabilities | (12.2) | (0.2) | (0.8) |
| Deferred tax | 11.1 | 20.4 | 7.9 |
| Other net assets | 40.4 | 5.6 | 10.0 |
| Total net assets | 425.8 | 421.7 | 473.7 |
| Return on invested capital (ROIC) | 29.9% | 25.4% | 26.4% |
| Mitie Group – Summary Cash Flow and Net Debt £m | Actuals FY22 | Actuals FY23 | Actuals FY24 |
|---|---|---|---|
| Operating profit before other items | 166.9 | 162.1 | 210.2 |
| Add back: depreciation, amortisation & impairment | 51.6 | 52.4 | 57.9 |
| EBITDA before other items | 218.5 | 214.5 | 268.1 |
| Other items | (14.6) | (23.7) | (37.6) |
| Other operating movements | (4.0) | 3.9 | |
| Operating cash flows before movements in working capital | 203.9 | 186.8 | 234.4 |
| Working capital movements (1) | 41.2 | (38.8) | (4.3) |
| Capex, capital element of lease payments & other | (69.1) | (59.6) | (54.3) |
| Interest payments | (17.2) | (11.9) | (9.7) |
| Tax payments | (16.2) | (19.8) | (16.9) |
| Dividends from joint ventures | 4.0 | 9.0 | 8.4 |
| Free cash inflow | 146.6 | 65.7 | 157.6 |
| Share buybacks (2) | – | (50.7) | (50.4) |
| Rights issue | – | – | – |
| Purchase of own shares into trusts | (13.8) | (37.7) | (19.6) |
| Acquisitions (3) | 5.0 | (20.2) | (34.7) |
| Dividends paid | (5.7) | (28.9) | (44.0) |
| Lease liabilities & other | (18.7) | 1.0 | (45.6) |
| Increase in net debt during the year | 113.4 | (70.8) | (36.7) |
| Closing net (debt) | 26.7 | (44.1) | (80.8) |
| Average daily net (debt) | (24.7) | (84.3) | (160.7) |
| Leverage (4) (average daily net debt / EBITDA before other items) | 0.1x | 0.4x | 0.6x |
Notes:
- Adjusted to exclude movements in restricted cash and other adjustments which do not form part of net debt (as explained in the Alternative Performance Measures appendix to the 2024 Annual Report & Accounts)
- FY24 share buybacks are presented net of the proceeds received from the exercise of SAYE schemes
- FY23 includes £3.6m of debt acquired with acquisitions
- Leverage uses post-IFRS 16 net debt